
跟我学Spring Cloud(Finchley版)-15-Hystrix监控详解
Hystrix提供了监控Hystrix Command的能力,本节来详细探讨。
监控端点与数据
应用整合Hystrix,同时应用包含spring-boot-starter-actuator 依赖,就会存在一个/actuator/hystrix.stream 端点,用来监控Hystrix Command。当被@HystrixCommand 注解了的方法被调用时,就会产生监控信息,并暴露到该端点中。当然,该端点默认是不会暴露的,需使用如下配置将其暴露。
1 | management: |
此时,访问/actuator/hystrix.stream 可返回如下结果:
1 | {"type":"HystrixCommand","name":"findById","group":"MovieController","currentTime":1547905939151,"isCircuitBreakerOpen":false,"errorPercentage":0,"errorCount":0,"requestCount":0,"rollingCountBadRequests":0,"rollingCountCollapsedRequests":0,"rollingCountEmit":0,"rollingCountExceptionsThrown":0,"rollingCountFailure":0,"rollingCountFallbackEmit":0,"rollingCountFallbackFailure":0,"rollingCountFallbackMissing":0,"rollingCountFallbackRejection":0,"rollingCountFallbackSuccess":0,"rollingCountResponsesFromCache":0,"rollingCountSemaphoreRejected":0,"rollingCountShortCircuited":0,"rollingCountSuccess":0,"rollingCountThreadPoolRejected":0,"rollingCountTimeout":0,"currentConcurrentExecutionCount":0,"rollingMaxConcurrentExecutionCount":0,"latencyExecute_mean":0,"latencyExecute":{"0":0,"25":0,"50":0,"75":0,"90":0,"95":0,"99":0,"99.5":0,"100":0},"latencyTotal_mean":0,"latencyTotal":{"0":0,"25":0,"50":0,"75":0,"90":0,"95":0,"99":0,"99.5":0,"100":0},"propertyValue_circuitBreakerRequestVolumeThreshold":20,"propertyValue_circuitBreakerSleepWindowInMilliseconds":5000,"propertyValue_circuitBreakerErrorThresholdPercentage":50,"propertyValue_circuitBreakerForceOpen":false,"propertyValue_circuitBreakerForceClosed":false,"propertyValue_circuitBreakerEnabled":true,"propertyValue_executionIsolationStrategy":"THREAD","propertyValue_executionIsolationThreadTimeoutInMilliseconds":1000,"propertyValue_executionTimeoutInMilliseconds":1000,"propertyValue_executionIsolationThreadInterruptOnTimeout":true,"propertyValue_executionIsolationThreadPoolKeyOverride":null,"propertyValue_executionIsolationSemaphoreMaxConcurrentRequests":10,"propertyValue_fallbackIsolationSemaphoreMaxConcurrentRequests":10,"propertyValue_metricsRollingStatisticalWindowInMilliseconds":10000,"propertyValue_requestCacheEnabled":true,"propertyValue_requestLogEnabled":true,"reportingHosts":1,"threadPool":"MovieController"} |
对于Feign
前面讲过Feign默认已经整合了Hystrix,但这个整合其实是“不完整”,因为它默认不带有监控端点,如果你在使用Feign的同时,也想使用监控端点,需按照如下步骤操作:
加依赖
1
2
3
4<dependency>
<groupId>org.springframework.cloud</groupId>
<artifactId>spring-cloud-starter-netflix-hystrix</artifactId>
</dependency>在启动类上添加注解
@EnableCircuitBreaker在
application.yml中添加如下配置:1
2
3
4
5management:
endpoints:
web:
exposure:
include: 'hystrix.stream'
可视化监控数据
至此,我们已可通过/actuator/hystrix.strem 端点观察Hystrix运行情况,但文字形式的监控数据很不直观。现实项目中一般都需要一个可视化的界面,这样才能迅速了解系统的运行情况。Hystrix提供了一个轮子——Hystrix Dashboard,它的作用只有一个,那就是将文字形式的监控数据转换成图表展示。
编写Hystrix Dashboard
加依赖
1
2
3
4<dependency>
<groupId>org.springframework.cloud</groupId>
<artifactId>spring-cloud-starter-netflix-hystrix-dashboard</artifactId>
</dependency>加注解:
@EnableHystrixDashboard写配置:
1
2
3# 端口随便写,这里只是表明下自己的端口规划而已
server:
port: 8030启动后,访问
http://localhost:8030/hystrix即可看到类似如下的界面:
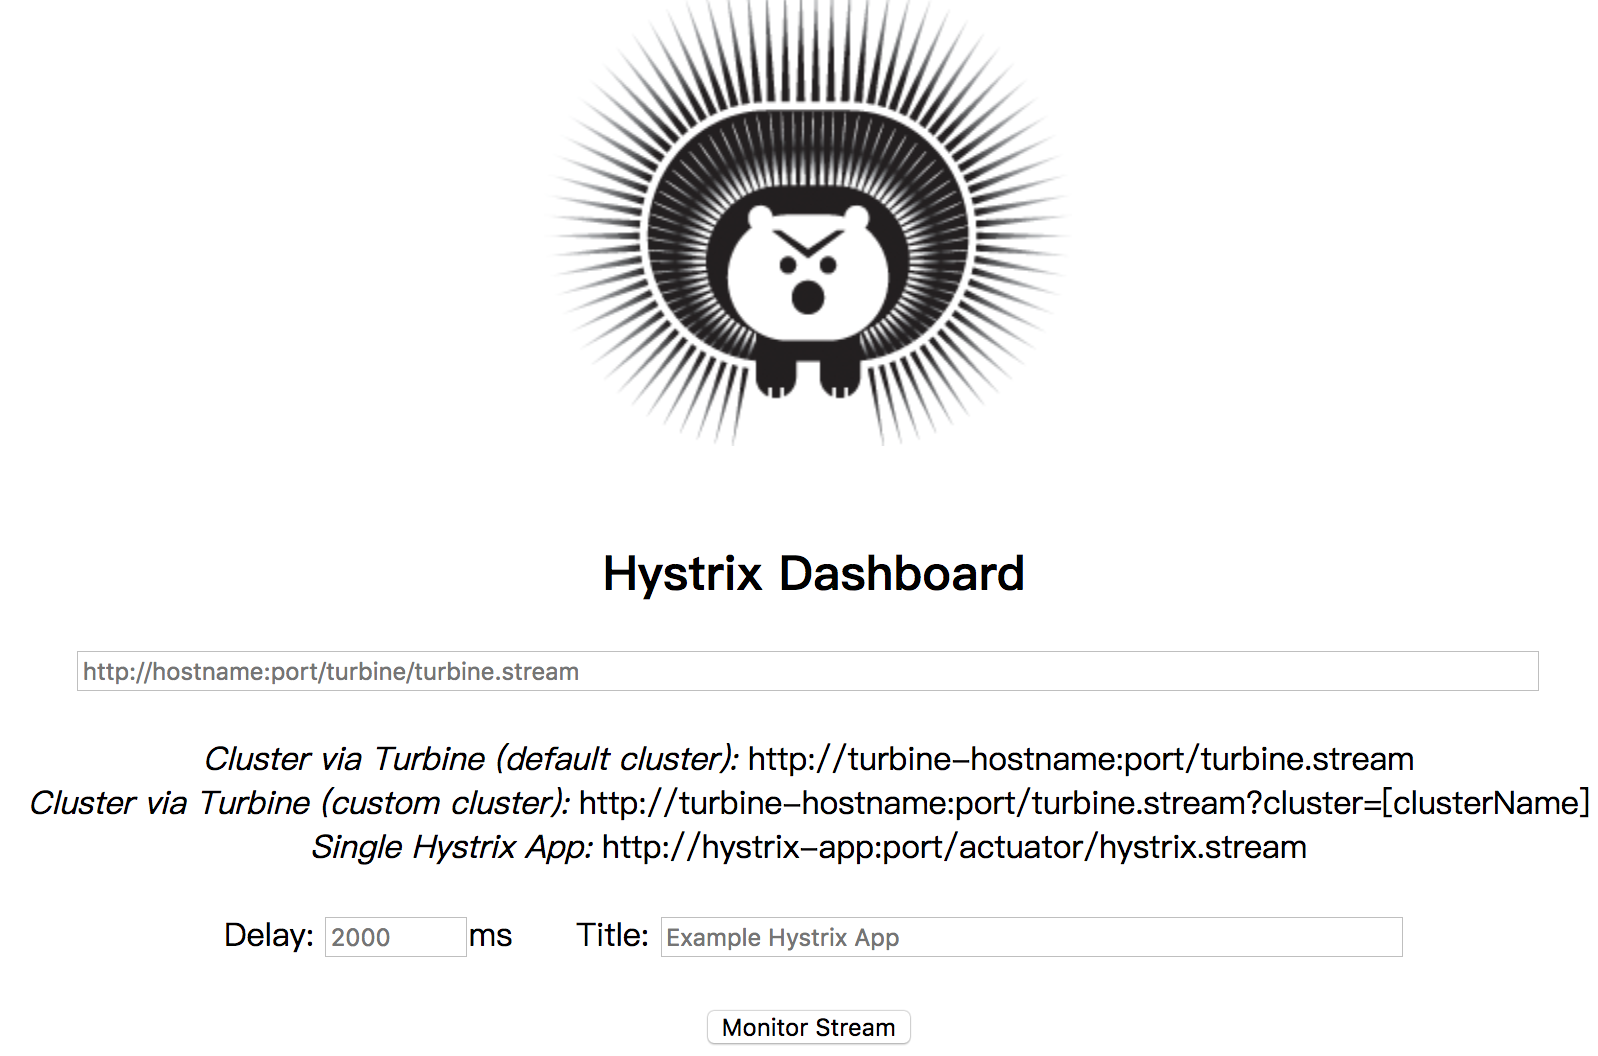
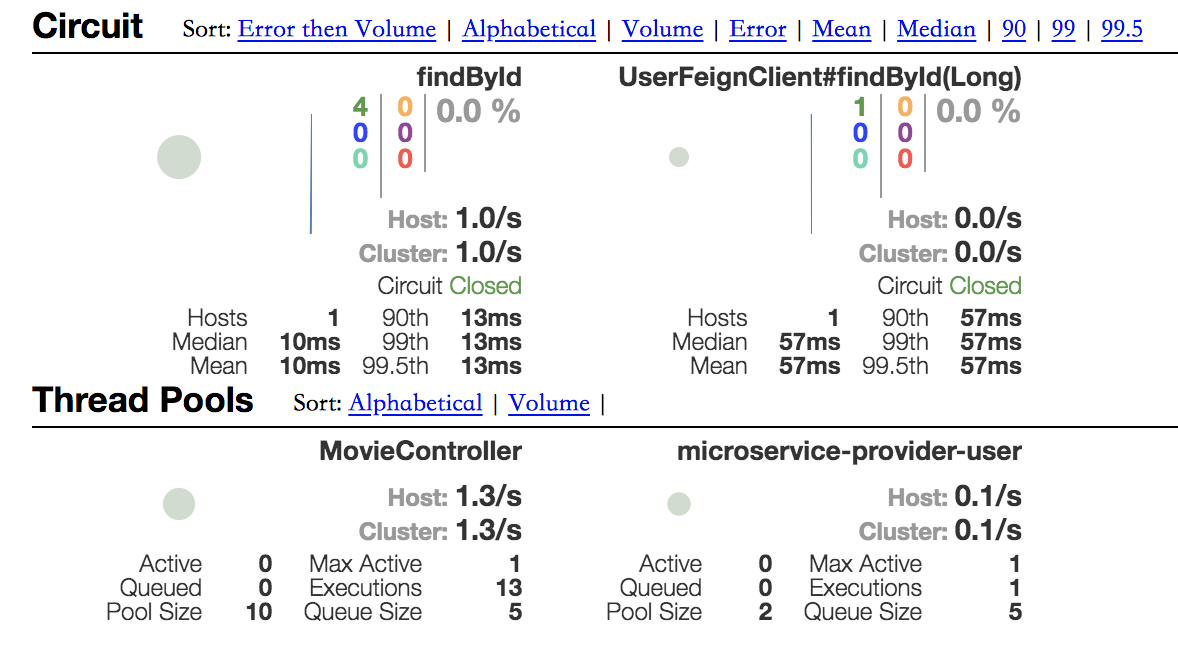
将上文的/actuator/hystrix.stream 端点的地址贴到图中,并指定Title,然后点击Monitor Stream 按钮,即可看到类似如下的图表:
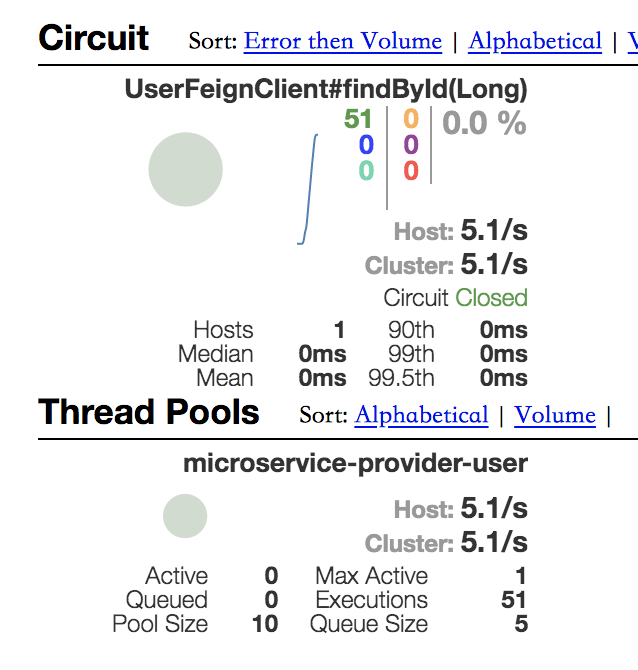
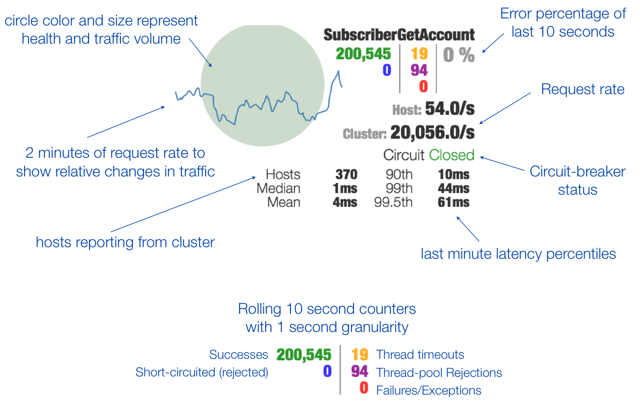
图表解读
小技巧
如果对http://localhost:8030/hystrix 地址中的hystrix 小尾巴不满意怎么办?还记得Spring MVC的服务器端跳转(forward)吗?只需添加类似如下的Controller,就可以使用http://localhost:8030/ 访问到Hystrix Dashboard首页了。
1 |
|
监控数据聚合-Turbine
至此,我们已实现监控数据的可视化,然而现阶段一次只能监控一个微服务实例,这显然不能适用于生产。为了能监控多个微服务,Netflix官方再次发挥造轮子的精神——它们又编写了一个组件,Turbine。
TIPS
吐槽一下,Turbine是一个“发布即死亡”的项目——2014年9月发布1.0.0后,2014年11月又迅速推出2.0.0.DP,之后基本就不维护了,至今已经4年没有提交过代码了。
Spring Cloud中,1.0.0以及2.0.0.DP两个版本都有使用。Turbine 1.0.0用于基于HTTP方式的数据收集(也就是本节讲的这种方式)Turbine 2.0.0.DP2则用于基于MQ方式的收集(这种方式很多人遇到问题,单独写一篇番外吧)
Turbine简介
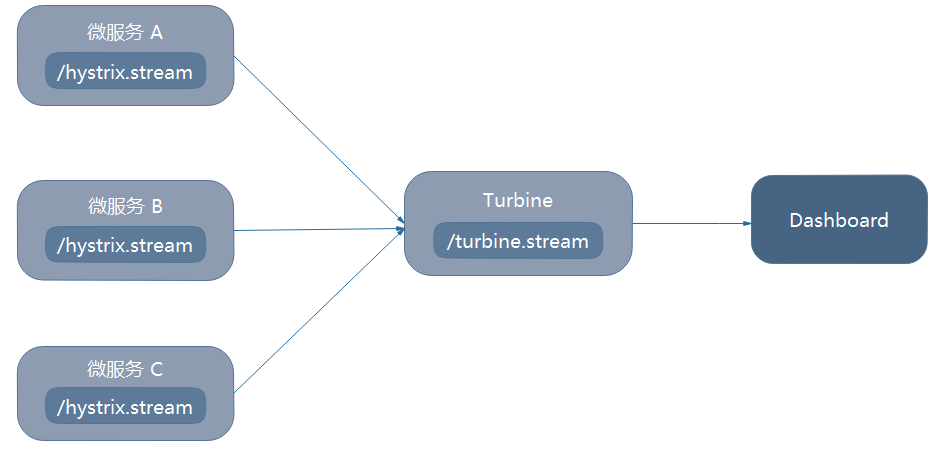
Turbine是一个聚合Hystrix监控数据的工具,它可将所有相关/hystrix.stream端点的数据聚合到一个组合的/turbine.stream中,从而让集群的监控更加方便。
引入Turbine后,架构图如下:
TIPS
Turbine的GitHub:https://github.com/Netflix/Turbine
编写Turbine Server
加依赖
1
2
3
4<dependency>
<groupId>org.springframework.cloud</groupId>
<artifactId>spring-cloud-starter-netflix-turbine</artifactId>
</dependency>加注解:
@EnableTurbine写配置:
1
2
3
4
5
6
7
8
9
10
11
12
13
14
15server:
port: 8031
spring:
application:
name: microservice-hystrix-turbine
eureka:
client:
service-url:
defaultZone: http://localhost:8761/eureka/
instance:
prefer-ip-address: true
turbine:
# 要监控的微服务列表,多个用,分隔
appConfig: microservice-consumer-movie,microservice-consumer-movie-feign
clusterNameExpression: "'default'"这样,Tubine即可聚合microservice-consumer-movie,microservice-consumer-movie-feign两个服务的
/actuator/hystrix.stream信息,并暴露在http://localhost:8031/turbine.stream,将该地址贴到Hystrix Dashboard上,即可看到类似如下的图表:
配套代码
通用方式暴露/actuator/hystrix.stream 端点:
- GitHub:https://github.com/eacdy/spring-cloud-study/tree/master/2018-Finchley/microservice-consumer-movie-ribbon-hystrix-common
- Gitee:https://gitee.com/itmuch/spring-cloud-study/tree/master/2018-Finchley/microservice-consumer-movie-ribbon-hystrix-common
Feign暴露/actuaotr/hystrix.stream 端点:
- GitHub:https://github.com/eacdy/spring-cloud-study/tree/master/2018-Finchley/microservice-consumer-movie-feign-hystrix-stream
- Gitee:https://gitee.com/itmuch/spring-cloud-study/tree/master/2018-Finchley/microservice-consumer-movie-feign-hystrix-stream
Hystrix Dashboard:
- GitHub:https://github.com/eacdy/spring-cloud-study/tree/master/2018-Finchley/microservice-hystrix-dashboard
- Gitee:https://gitee.com/itmuch/spring-cloud-study/tree/master/2018-Finchley/microservice-hystrix-dashboard
Turbine:
- GitHub:https://github.com/eacdy/spring-cloud-study/tree/master/2018-Finchley/microservice-hystrix-turbine
- Gitee:https://gitee.com/itmuch/spring-cloud-study/tree/master/2018-Finchley/microservice-hystrix-turbine
评论系统未开启,无法评论!