
Spring Cloud Sleuth使用ELK收集&分析日志
TIPS
本文基于Spring Cloud Greenwich SR2,理论兼容Spring Cloud所有版本。
应用整合
加依赖:
1
2
3
4
5
6
7
8
9<dependency>
<groupId>org.springframework.cloud</groupId>
<artifactId>spring-cloud-starter-sleuth</artifactId>
</dependency>
<dependency>
<groupId>net.logstash.logback</groupId>
<artifactId>logstash-logback-encoder</artifactId>
<version>6.1</version>
</dependency>注意,
logstash-logback-encoder的版本务必和Logback兼容,否则会导致应用启动不起来,而且不会打印任何日志!可前往https://github.com/logstash/logstash-logback-encoder查看和Logback的兼容性。在
resources目录下创建配置文件:logback-spring.xml,内容如下:1
2
3
4
5
6
7
8
9
10
11
12
13
14
15
16
17
18
19
20
21
22
23
24
25
26
27
28
29
30
31
32
33
34
35
36
37
38
39
40
41
42
43
44
45
46
47
48
49
50
51
52
53
54
55
56
57
58
59
60
61
62
63
64
65
66
67
68
69
70
71
72
73
74
75
76
<configuration>
<include resource="org/springframework/boot/logging/logback/defaults.xml"/>
<springProperty scope="context" name="springAppName" source="spring.application.name"/>
<!-- Example for logging into the build folder of your project -->
<property name="LOG_FILE" value="/Users/reno/Desktop/未命名文件夹/elk/logs/${springAppName}"/>
<!-- You can override this to have a custom pattern -->
<property name="CONSOLE_LOG_PATTERN"
value="%clr(%d{yyyy-MM-dd HH:mm:ss.SSS}){faint} %clr(${LOG_LEVEL_PATTERN:-%5p}) %clr(${PID:- }){magenta} %clr(---){faint} %clr([%15.15t]){faint} %clr(%-40.40logger{39}){cyan} %clr(:){faint} %m%n${LOG_EXCEPTION_CONVERSION_WORD:-%wEx}"/>
<!-- Appender to log to console -->
<appender name="console" class="ch.qos.logback.core.ConsoleAppender">
<filter class="ch.qos.logback.classic.filter.ThresholdFilter">
<!-- Minimum logging level to be presented in the console logs-->
<level>DEBUG</level>
</filter>
<encoder>
<pattern>${CONSOLE_LOG_PATTERN}</pattern>
<charset>utf8</charset>
</encoder>
</appender>
<!-- Appender to log to file -->
<appender name="flatfile" class="ch.qos.logback.core.rolling.RollingFileAppender">
<file>${LOG_FILE}</file>
<rollingPolicy class="ch.qos.logback.core.rolling.TimeBasedRollingPolicy">
<fileNamePattern>${LOG_FILE}.%d{yyyy-MM-dd}.gz</fileNamePattern>
<maxHistory>7</maxHistory>
</rollingPolicy>
<encoder>
<pattern>${CONSOLE_LOG_PATTERN}</pattern>
<charset>utf8</charset>
</encoder>
</appender>
<!-- Appender to log to file in a JSON format -->
<appender name="logstash" class="ch.qos.logback.core.rolling.RollingFileAppender">
<file>${LOG_FILE}.json</file>
<rollingPolicy class="ch.qos.logback.core.rolling.TimeBasedRollingPolicy">
<fileNamePattern>${LOG_FILE}.json.%d{yyyy-MM-dd}.gz</fileNamePattern>
<maxHistory>7</maxHistory>
</rollingPolicy>
<encoder class="net.logstash.logback.encoder.LoggingEventCompositeJsonEncoder">
<providers>
<timestamp>
<timeZone>UTC</timeZone>
</timestamp>
<pattern>
<pattern>
{
"severity": "%level",
"service": "${springAppName:-}",
"trace": "%X{X-B3-TraceId:-}",
"span": "%X{X-B3-SpanId:-}",
"parent": "%X{X-B3-ParentSpanId:-}",
"exportable": "%X{X-Span-Export:-}",
"pid": "${PID:-}",
"thread": "%thread",
"class": "%logger{40}",
"rest": "%message"
}
</pattern>
</pattern>
</providers>
</encoder>
</appender>
<root level="INFO">
<appender-ref ref="console"/>
<!-- uncomment this to have also JSON logs -->
<appender-ref ref="logstash"/>
<!--<appender-ref ref="flatfile"/>-->
</root>
</configuration>新建
bootstrap.yml,并将application.yml中的以下属性移到bootstrap.yml中。1
2
3spring:
application:
name: user-center由于上面的
logback-spring.xml含有变量(例如springAppName),故而spring.application.name属性必须设置在bootstrap.yml文件中,否则,logback-spring.xml将无法正确读取属性。
测试
启动应用
日志会打印到
/Users/reno/Desktop/未命名文件夹/elk/logs/目录中,并且文件名称为user-center.json,内容类似如下:1
2
3
4
5{"@timestamp":"2019-08-29T02:38:42.468Z","severity":"DEBUG","service":"microservice-provider-user","trace":"5cf9479e966fb5ec","span":"5cf9479e966fb5ec","parent":"","exportable":"false","pid":"13144","thread":"http-nio-8000-exec-1","class":"o.s.w.s.m.m.a.RequestResponseBodyMethodProcessor","rest":"Using 'application/json;q=0.8', given [text/html, application/xhtml+xml, image/webp, image/apng, application/signed-exchange;v=b3, application/xml;q=0.9, */*;q=0.8] and supported [application/json, application/*+json, application/json, application/*+json]"}
{"@timestamp":"2019-08-29T02:38:42.469Z","severity":"DEBUG","service":"microservice-provider-user","trace":"5cf9479e966fb5ec","span":"5cf9479e966fb5ec","parent":"","exportable":"false","pid":"13144","thread":"http-nio-8000-exec-1","class":"o.s.w.s.m.m.a.RequestResponseBodyMethodProcessor","rest":"Writing [Optional[User(id=1, username=account1, name=张三, age=20, balance=100.00)]]"}
{"@timestamp":"2019-08-29T02:38:42.491Z","severity":"DEBUG","service":"microservice-provider-user","trace":"5cf9479e966fb5ec","span":"5cf9479e966fb5ec","parent":"","exportable":"false","pid":"13144","thread":"http-nio-8000-exec-1","class":"o.s.o.j.s.OpenEntityManagerInViewInterceptor","rest":"Closing JPA EntityManager in OpenEntityManagerInViewInterceptor"}
{"@timestamp":"2019-08-29T02:38:42.492Z","severity":"DEBUG","service":"microservice-provider-user","trace":"5cf9479e966fb5ec","span":"5cf9479e966fb5ec","parent":"","exportable":"false","pid":"13144","thread":"http-nio-8000-exec-1","class":"o.s.web.servlet.DispatcherServlet","rest":"Completed 200 OK"}
{"@timestamp":"2019-08-29T02:38:58.141Z","severity":"ERROR","service":"microservice-provider-user","trace":"","span":"","parent":"","exportable":"","pid":"13144","thread":"ThreadPoolTaskScheduler-1","class":"o.s.c.alibaba.nacos.discovery.NacosWatch","rest":"Error watching Nacos Service change"}下面,只需要让Logstash收集到这个JSON文件,就可以在Kibana上检索日志啦!
ELK搭建
简单起见,本文使用Docker搭建ELK;其他搭建方式,请看官自行百度,比较简单,但很耗时。
创建
docker-compose.yml文件,内容如下:1
2
3
4
5
6
7
8
9
10
11
12
13
14
15
16
17
18
19
20
21
22
23
24version: '3'
services:
elasticsearch:
image: elasticsearch:7.3.1
environment:
discovery.type: single-node
ports:
- "9200:9200"
- "9300:9300"
logstash:
image: logstash:7.3.1
command: logstash -f /etc/logstash/conf.d/logstash.conf
volumes:
# 挂载logstash配置文件
- ./config:/etc/logstash/conf.d
- /Users/reno/Desktop/未命名文件夹/elk/logs/:/opt/build/
ports:
- "5000:5000"
kibana:
image: kibana:7.3.1
environment:
- ELASTICSEARCH_URL=http://elasticsearch:9200
ports:
- "5601:5601"需要注意,上面的
/Users/reno/Desktop/未命名文件夹/elk/logs/需要改成你应用的打印路径。在docker-compose.yml文件所在目录创建
config/logstash.conf,内容如下:1
2
3
4
5
6
7
8
9
10
11
12
13
14
15
16input {
file {
codec => json
path => "/opt/build/*.json" # 改成你项目打印的json日志文件。
}
}
filter {
grok {
match => { "message" => "%{TIMESTAMP_ISO8601:timestamp}\s+%{LOGLEVEL:severity}\s+\[%{DATA:service},%{DATA:trace},%{DATA:span},%{DATA:exportable}\]\s+%{DATA:pid}\s+---\s+\[%{DATA:thread}\]\s+%{DATA:class}\s+:\s+%{GREEDYDATA:rest}" }
}
}
output {
elasticsearch {
hosts => "elasticsearch:9200" # 改成你的Elasticsearch地址
}
}启动ELK
1
docker-compose up
测试Sleuth & ELK
访问你微服务的API,让它生成一些日志(如果产生日志比较少,可将
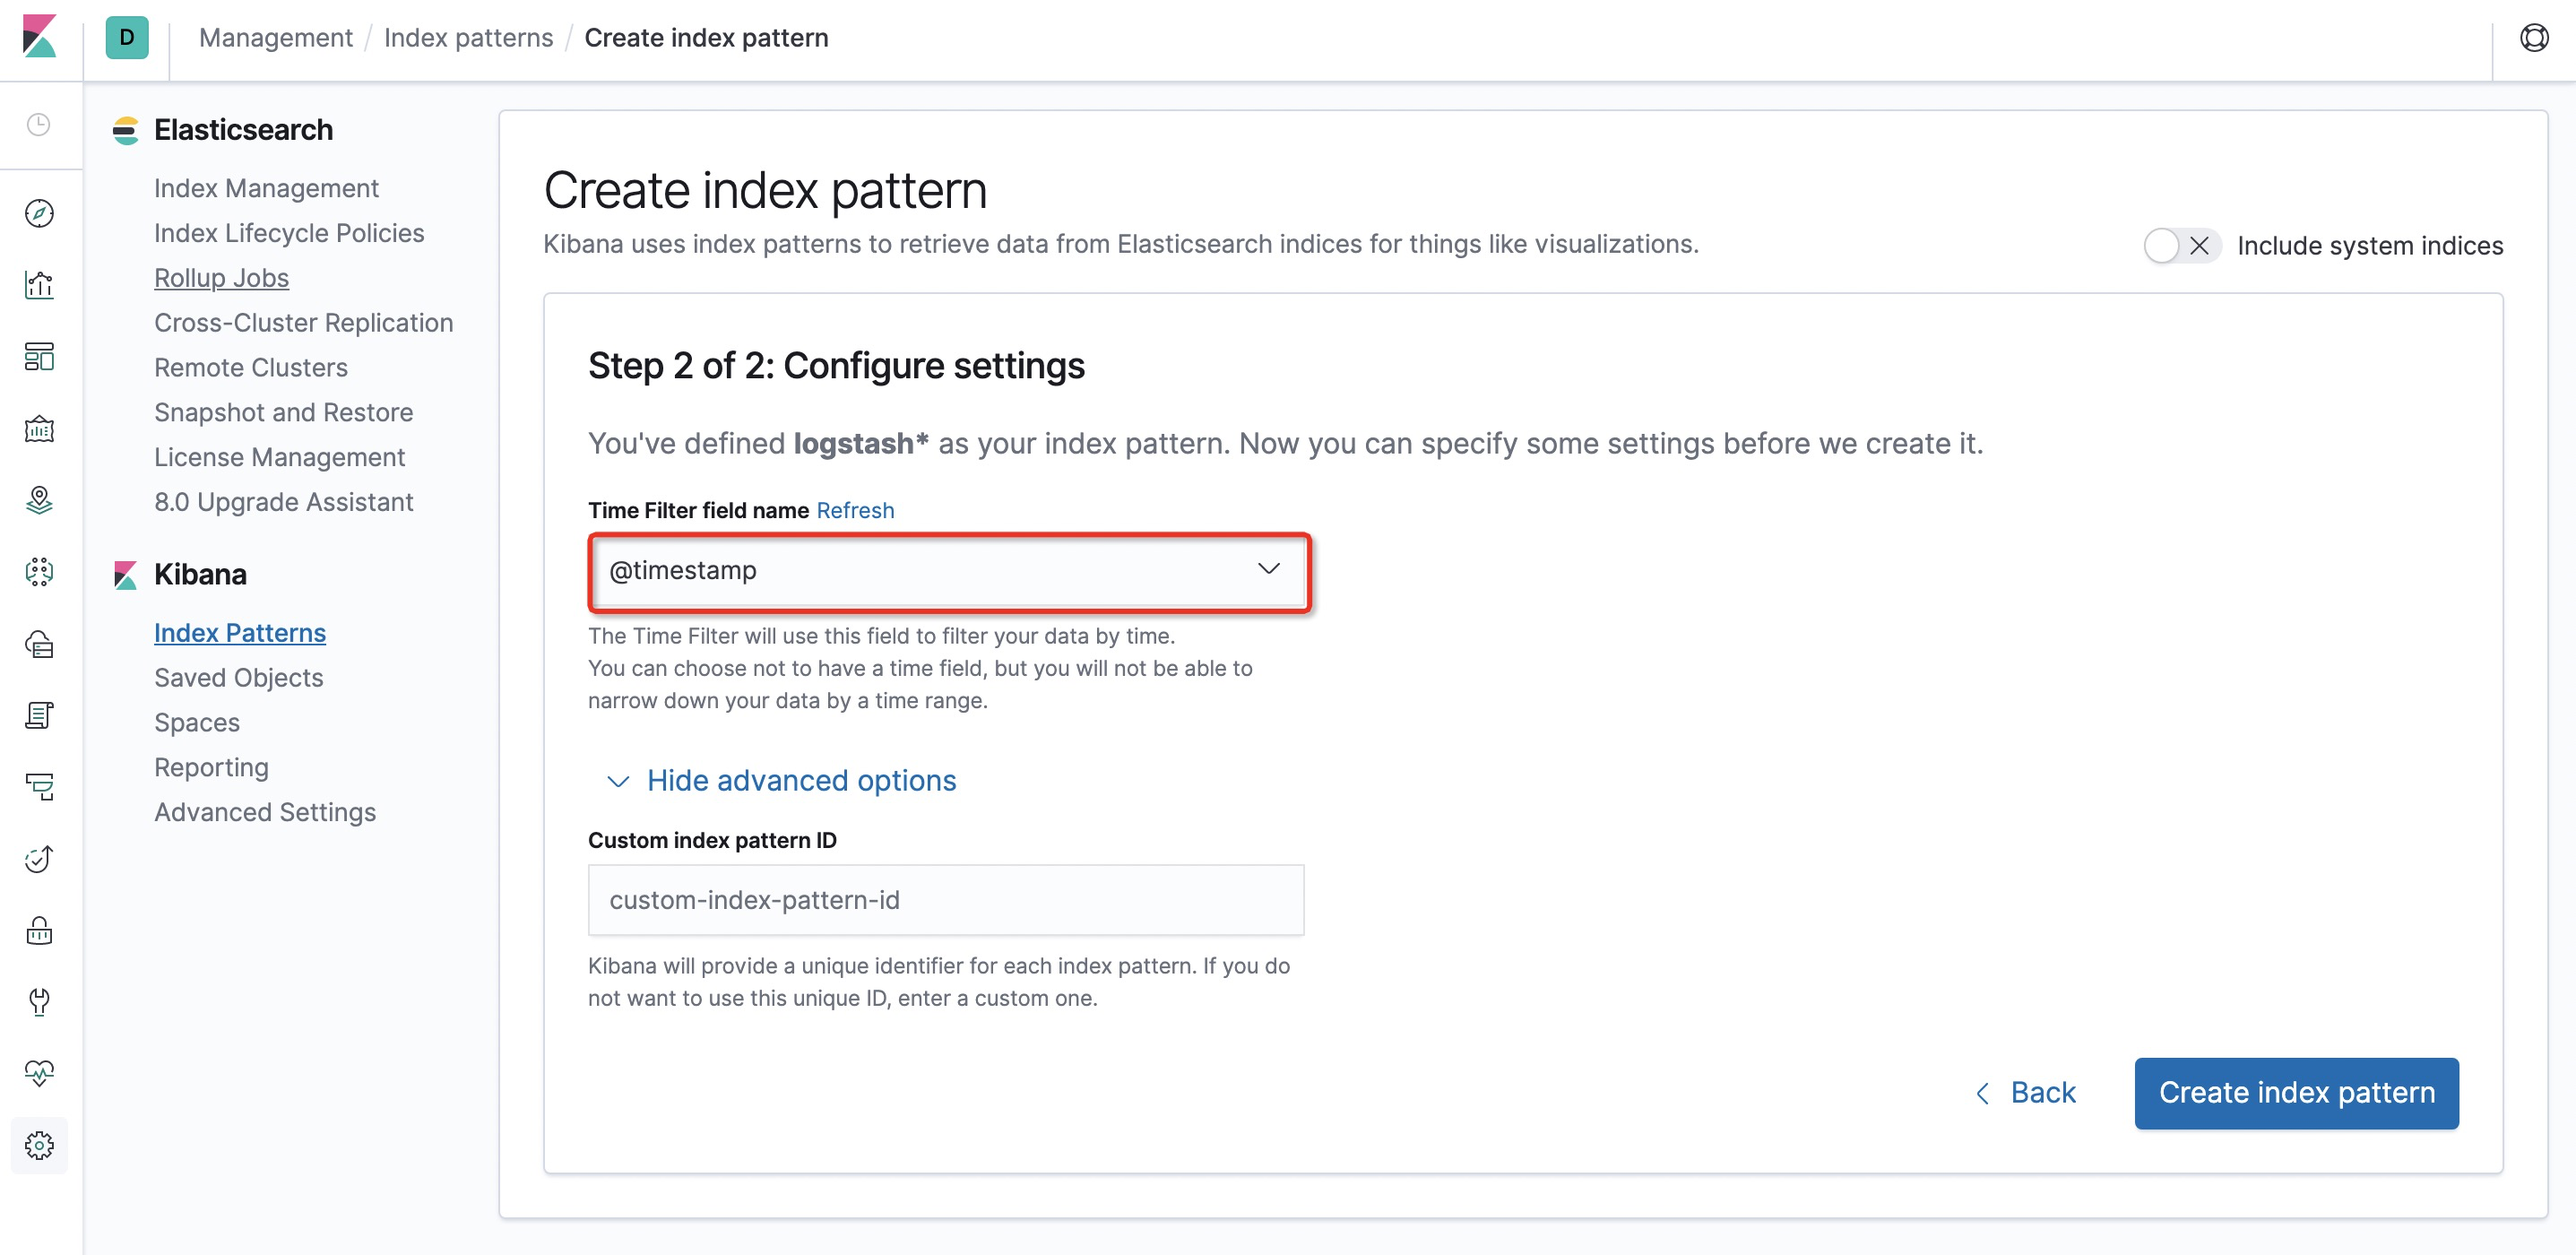
org.springframework包的日志级别设为debug)访问
http://localhost:5601(Kibana地址),可看到类似如下的界面,按照如图配置Kibana。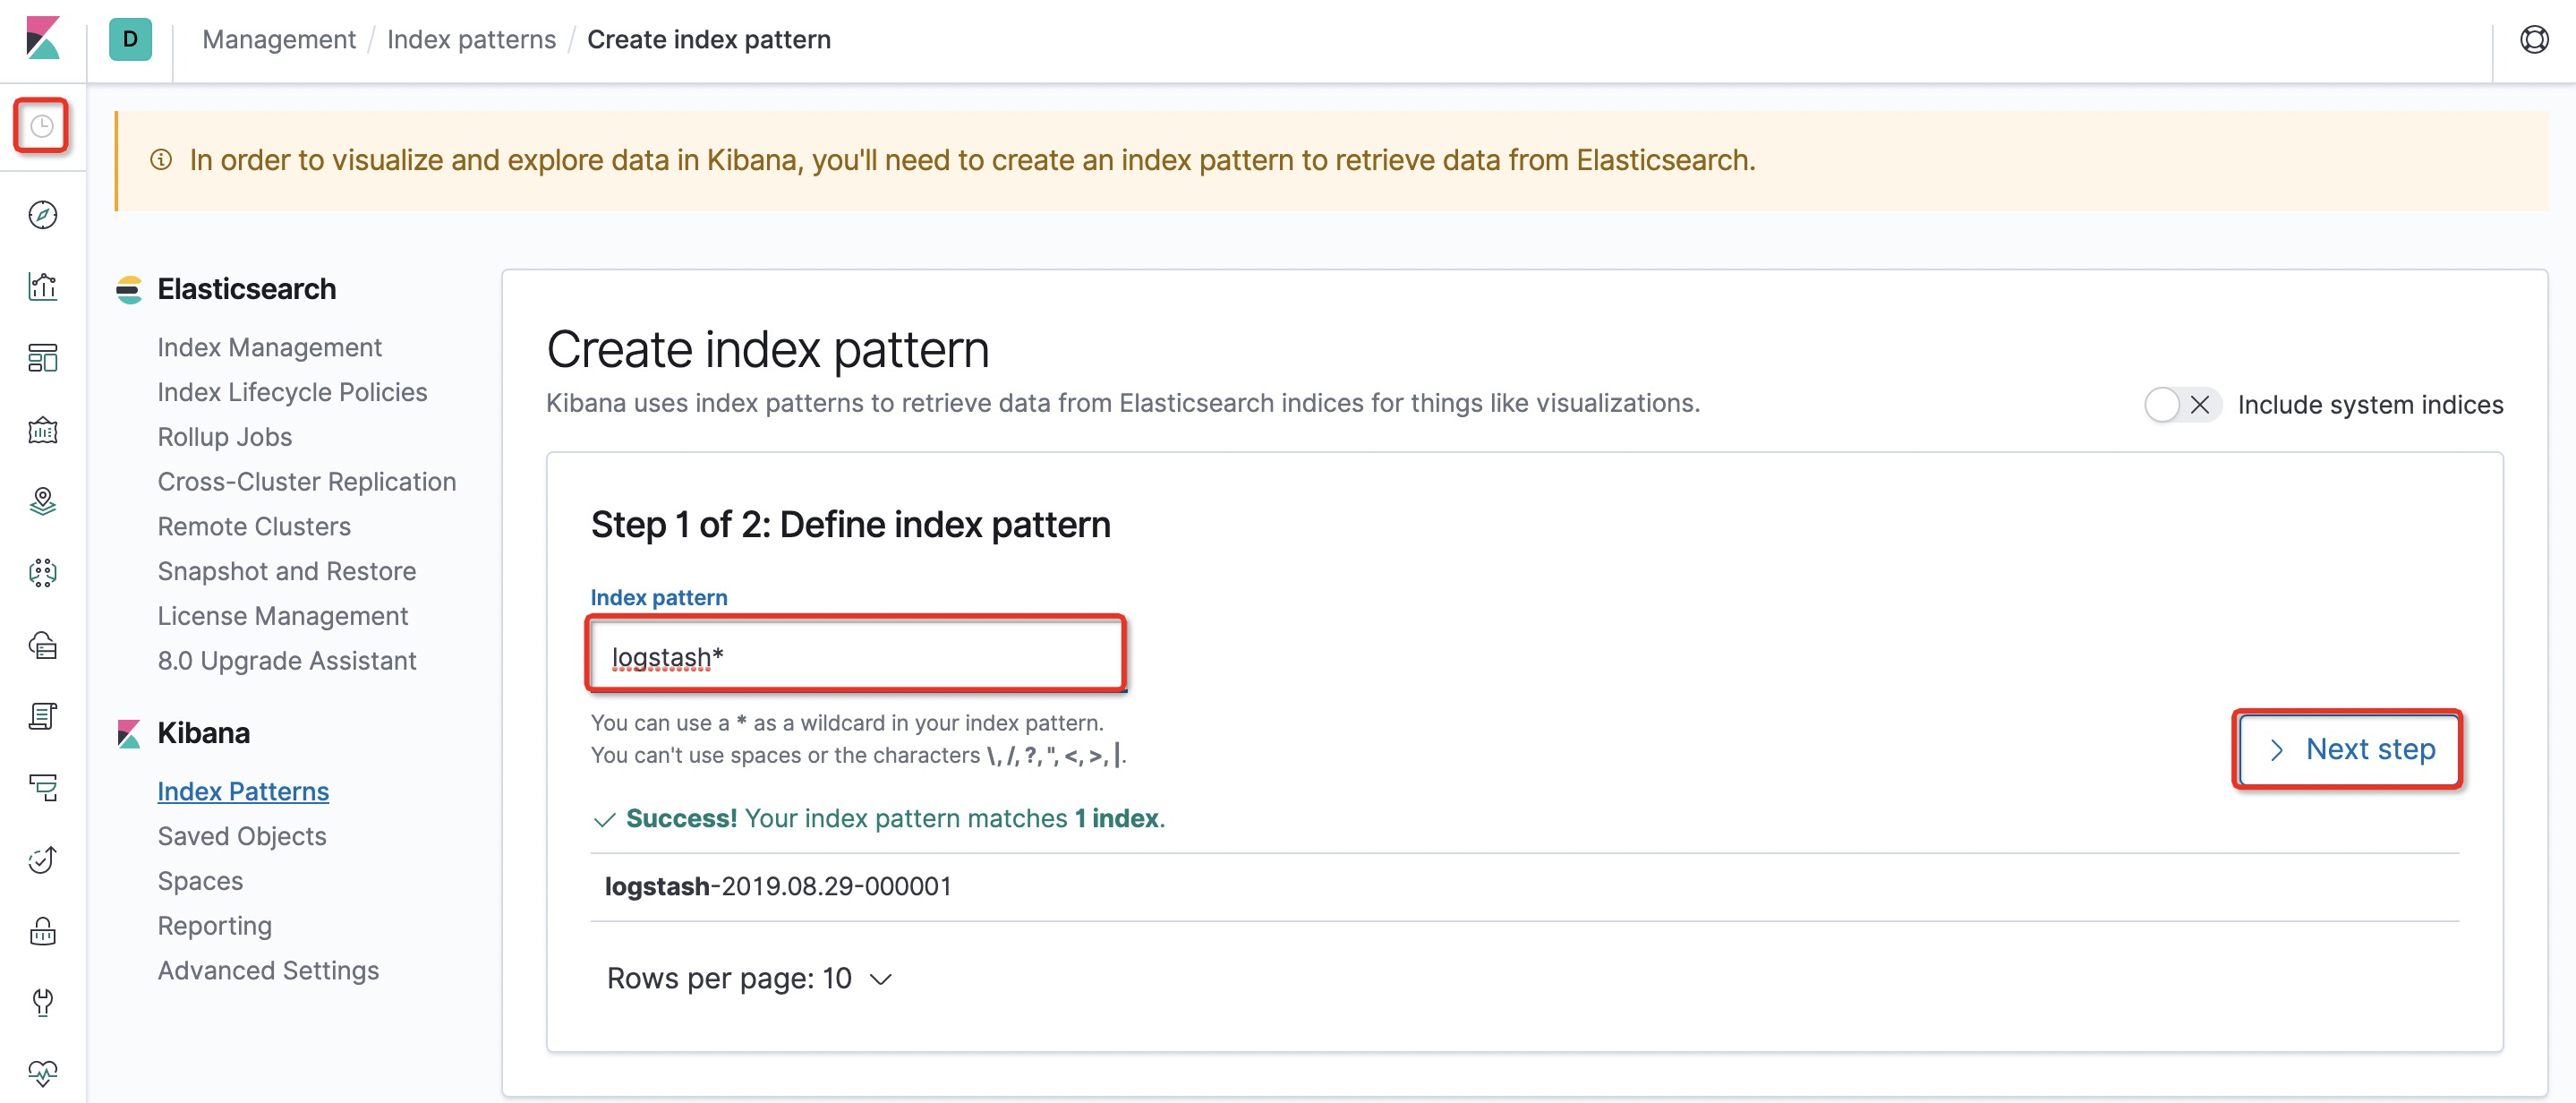
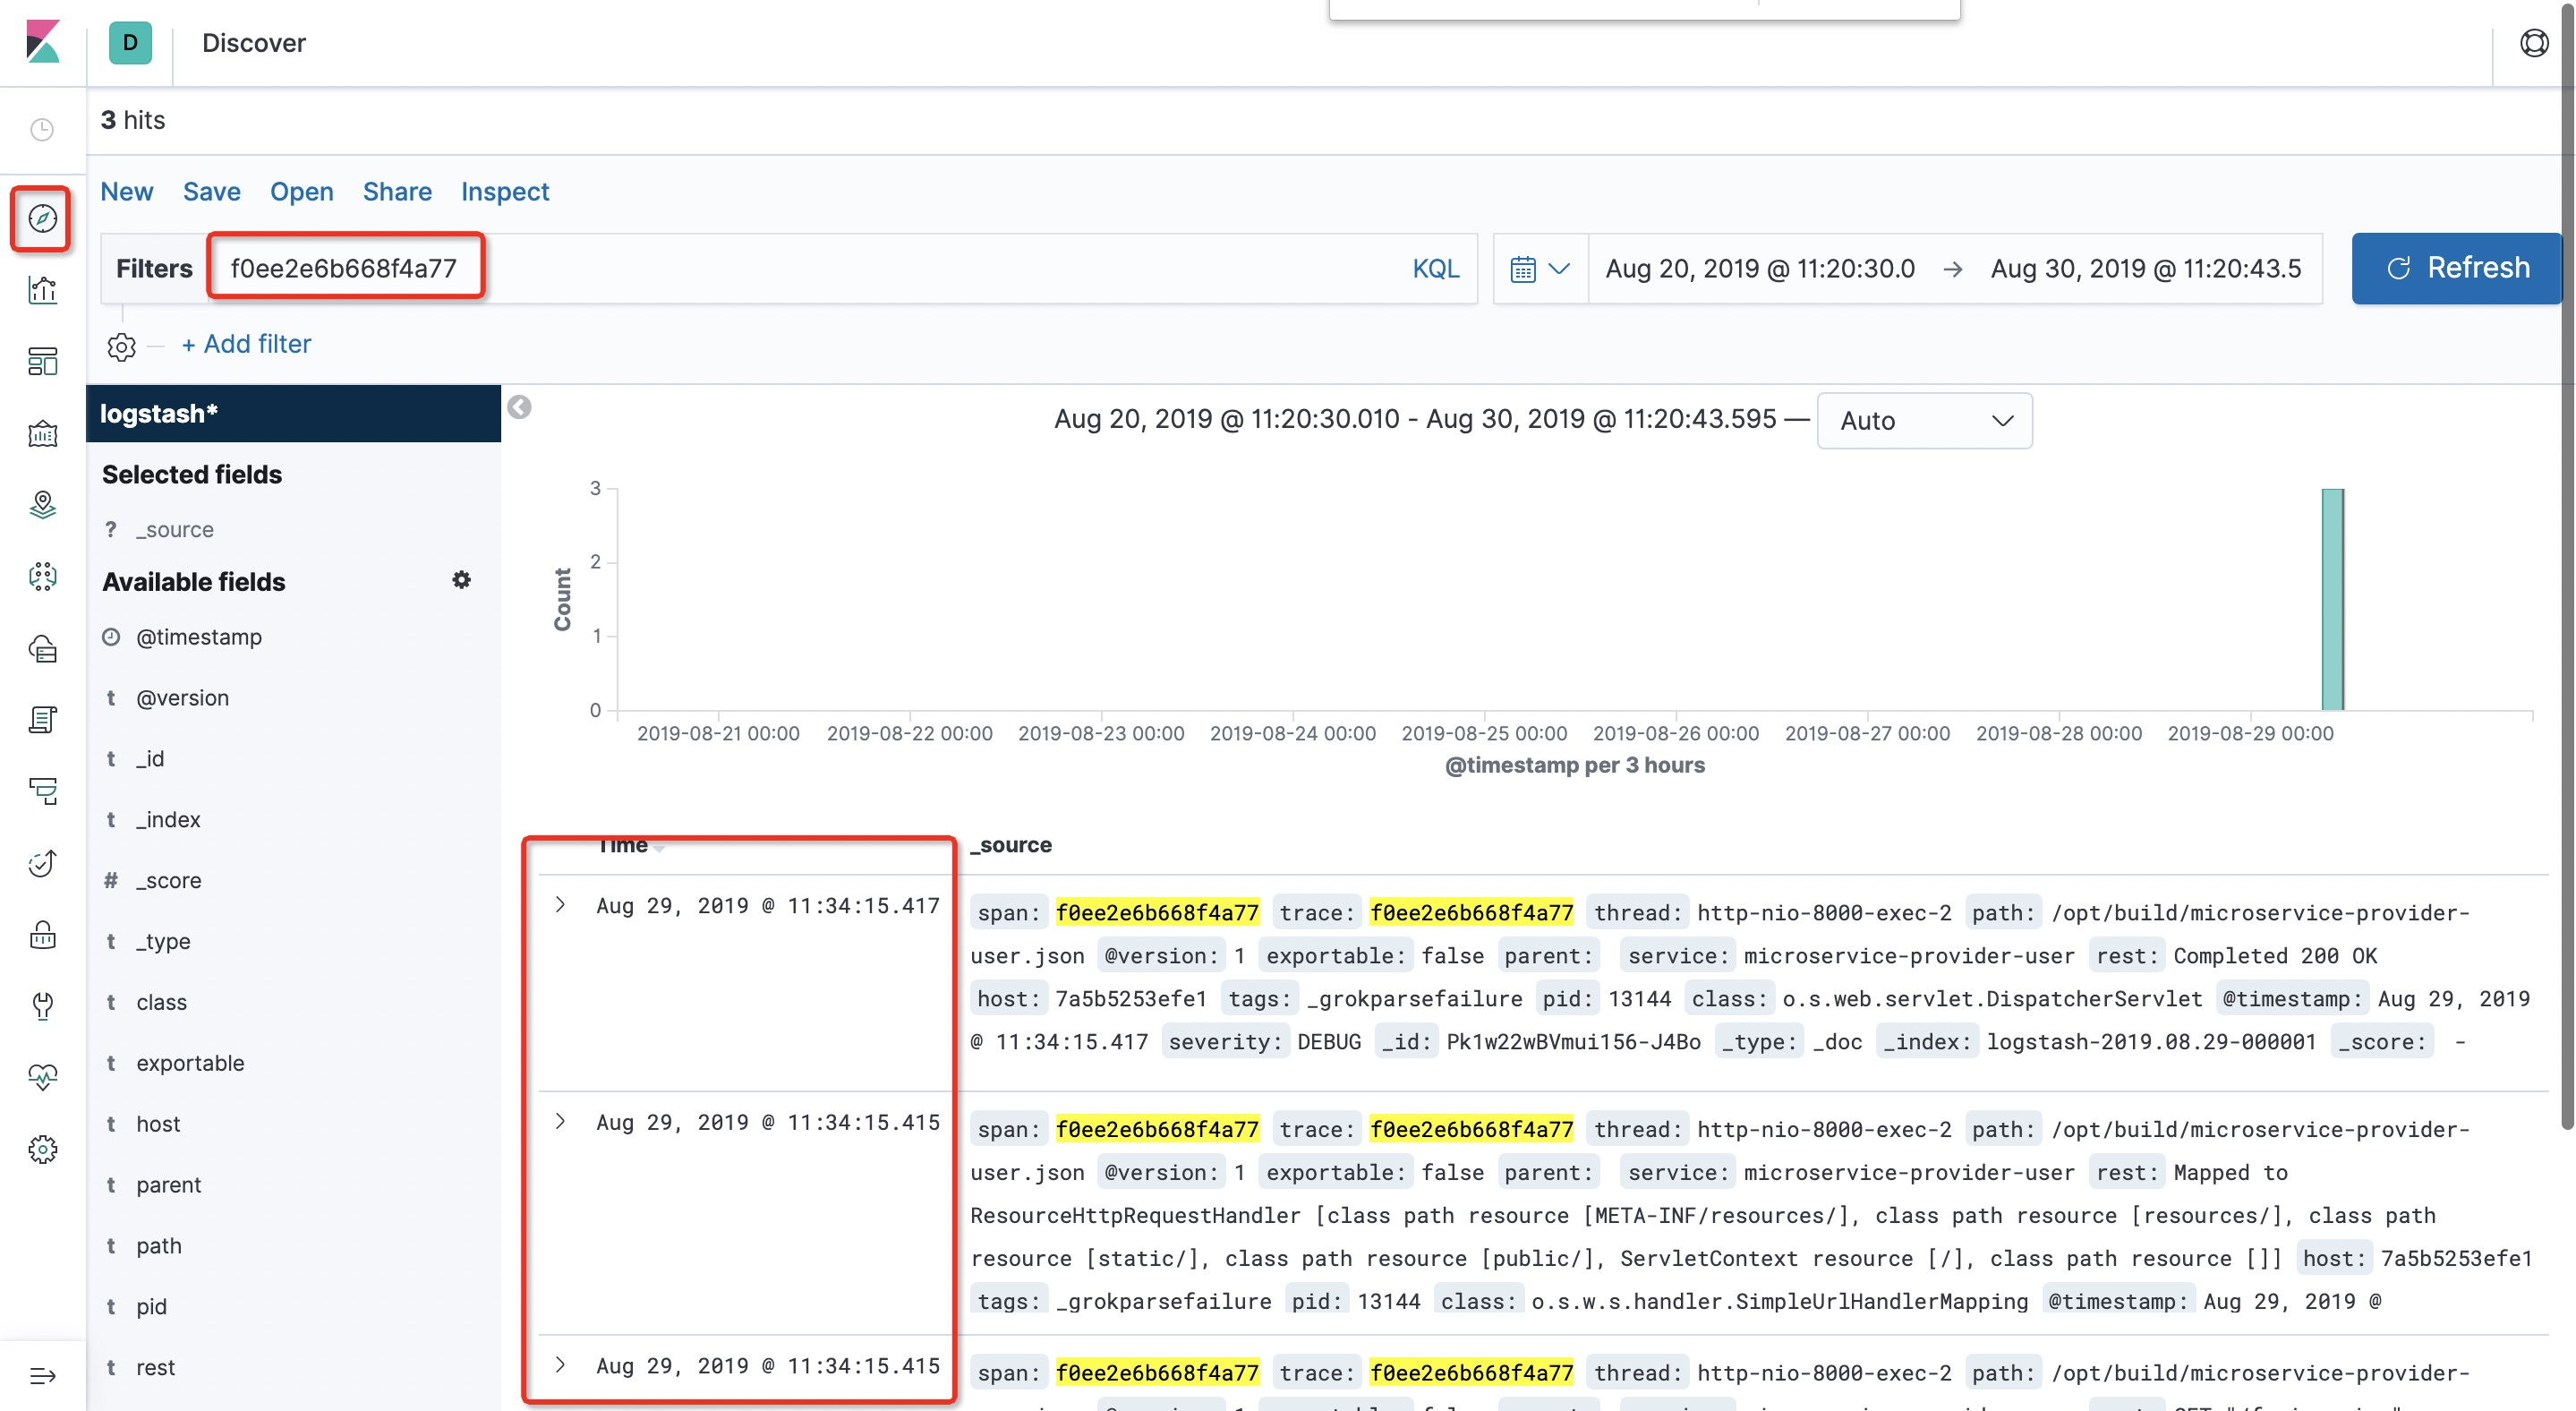
输入条件,即可分析日志:
原理分析
原理比较简单:
- 让Sleuth打印JSON格式的日志;
- 然后在Logstash的配置文件中,配置grok语法,解析并收集JSON格式的日志,并存储到Elasticsearch中去;
- Kibana可视化分析日志。
评论系统未开启,无法评论!